1. Navigate to the Reports app in GoCo using the tabs on the left side of the screen.

You will be redirected to your Reports App. Here, click the blue "+Add Report" button on the top right of your screen.

GoCo will then ask you what method you would like to use to create this report. You can create from scratch, choose to copy a report from another company you have access to/or a previous report you've created, or choose from our library of reports.

In this scenario, will choose to create from scratch & select "Team Member" as our report type. If you choose another method, simply follow the prompts to continue (Ex. Choose from Library will guide you into our Marketplace to download a template).
You're now able to continue and set your filters for this report. Keep reading to learn how!
2. You'll be redirected to a new screen to customize the report. First, you'll want to name & give the report a description. 
3. Now begin inputting the Basic settings.
Select your Report Fields, that is what fields/columns you want to include in this report. By default, you will see "First Name" & "Last Name", however, you can add additional fields by clicking the "+ Add Fields" button.
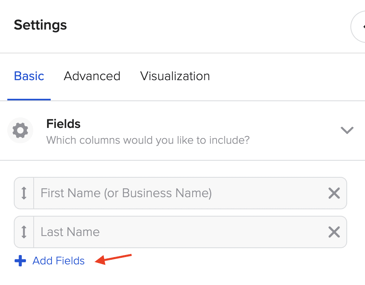
Notice you can add groups of fields at a time! Simply hit the check box icon next to the field type to add all fields in that category.

4. You will then be asked to select what filters, starting with Team Members, you want to add to the Report. 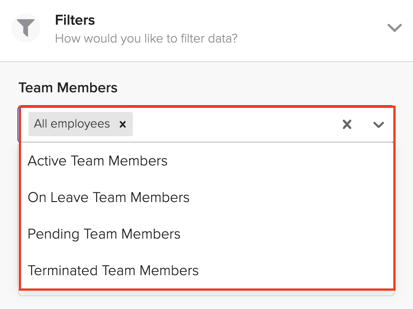
Filter from "All Employees", "Active Team Members" & more!
After selecting your team members, select any fields you want to set conditions around. For example, you can select "Last Name" "Does not contain" "Blank". Depending on your desired outcome, adjust as needed. (Please note available fields depend on your report type).
If you wish to layer any filters simply hit the "+Add more" button. 
5. Now decide if you want to Schedule your report to be sent automatically to your email.

A pop out will appear asking you to input your schedule settings. If you need more information on scheduling reports, click here!

6. After adjusting the Basic Settings, you should be ready to generate your report. To do so hit the "Generate Report" button in the center of your screen.

As your report is generated, you will see this progress bar. Please note that if you are creating a report with multiple different fields this may take a moment.
7. Your report is now generated!
- ⭐ Hint: you can also download your report as a CSV with the "Download" button on the top right corner. If you would like to schedule your report to be sent on a regular cadence to your email, check out this article.
8. Now that your report has been generated, it's time to check out your "Advanced" settings. Here you can drag & drop your columns to reorganize, filter & customize columns, & save this report for future use.
To group data by report fields, switch over to the "Advanced" tab & expand the "Grouping" section. You can select by one or multiple Report Fields to group by. Please note, that you can only choose the Report Fields you have already added in the Fields Section. If you have selected multiple, you can reorganize the hierarchy using Drag and Drop.

To show dependents data expand the "Show Dependents" section. You can enable this setting to show Dependent information in a subordinate table.
To show data as of a certain date or to view historical data, expand the "Display" section. Here you will see a few options. The default selection is "As of Today" - meaning that this will show all data as of Today.

The next option in this section is "Time Machine" - this is similar to our "As of Today" filter, however instead of showing data as of the day you're pulling the report, you can customize the date and select a date other than Today. 
If you select Custom Dates, a single calendar selector appears so that you can choose those custom dates.

The final option here is to "Show Change History". This presents a dropdown that allows you to select a date and view each change made for a team member during the selected time period. For more information on the "Show Change History" option, check out this help article.
Lastly in your "Advanced" settings, you can review your Permissions for this report.

9. Check out the "Visualization" tab to create graphs and visuals for your report. For more information on visual graphs - check out this help article!

Once your report is complete, you can either exit this report or save it for future use!
⭐ Please note that if you exit without saving, you will not be able to return to this report as it is a "One-Time Report".

Once this report has been saved, you will see it under the Custom Reports section of the Reports app. You can now view this report at any time with refreshed data. 
Happy Reporting! 📊
If you have additional questions please contact support@goco.io